PERSONAL PROJECT · USED AT DRANSAY
Initiative Ranking, a scoring tool for prioritising initiatives
- Period
- Mar 2026 to present
The problem it solves for an engineering manager
Prioritisation debates are hard to settle when every initiative is argued on different terms. The tool puts each initiative through the same inputs: the metrics it should move with an expected range of lift, how confident the evidence is, how many users it reaches, how much effort and complexity it carries, and how time-critical it is. The score is a number that can be challenged input by input. It does not replace the decision.
I built it myself, working with our Product Managers on what it should do. It supports one step of how we plan at DrAnsay: initiatives go into a backlog, and we later select from it against the OKRs proposed for the period. The tool is there so that each initiative carries an analysis of the metrics it should move, and we can rank with confidence. It is an internal tool at an experimental stage, and using it is optional for the teams.
How it works
Each initiative takes in an area, a maturity stage, tags, optional blockers and scores for reach, effort, complexity and time criticality. Alongside them go one or more metric hypotheses: an expected lift range for a metric, a confidence tier from one to five and an evidence note.
The scoring engine, in a shared package, divides reach times the confidence-weighted hypothesis value times time criticality by effort times complexity. Hypothesis value is the average of the lift range multiplied by a confidence factor, summed over the metrics. When an OKR is selected, only hypotheses on that OKR’s metrics count, each boosted by the weight set for that metric.
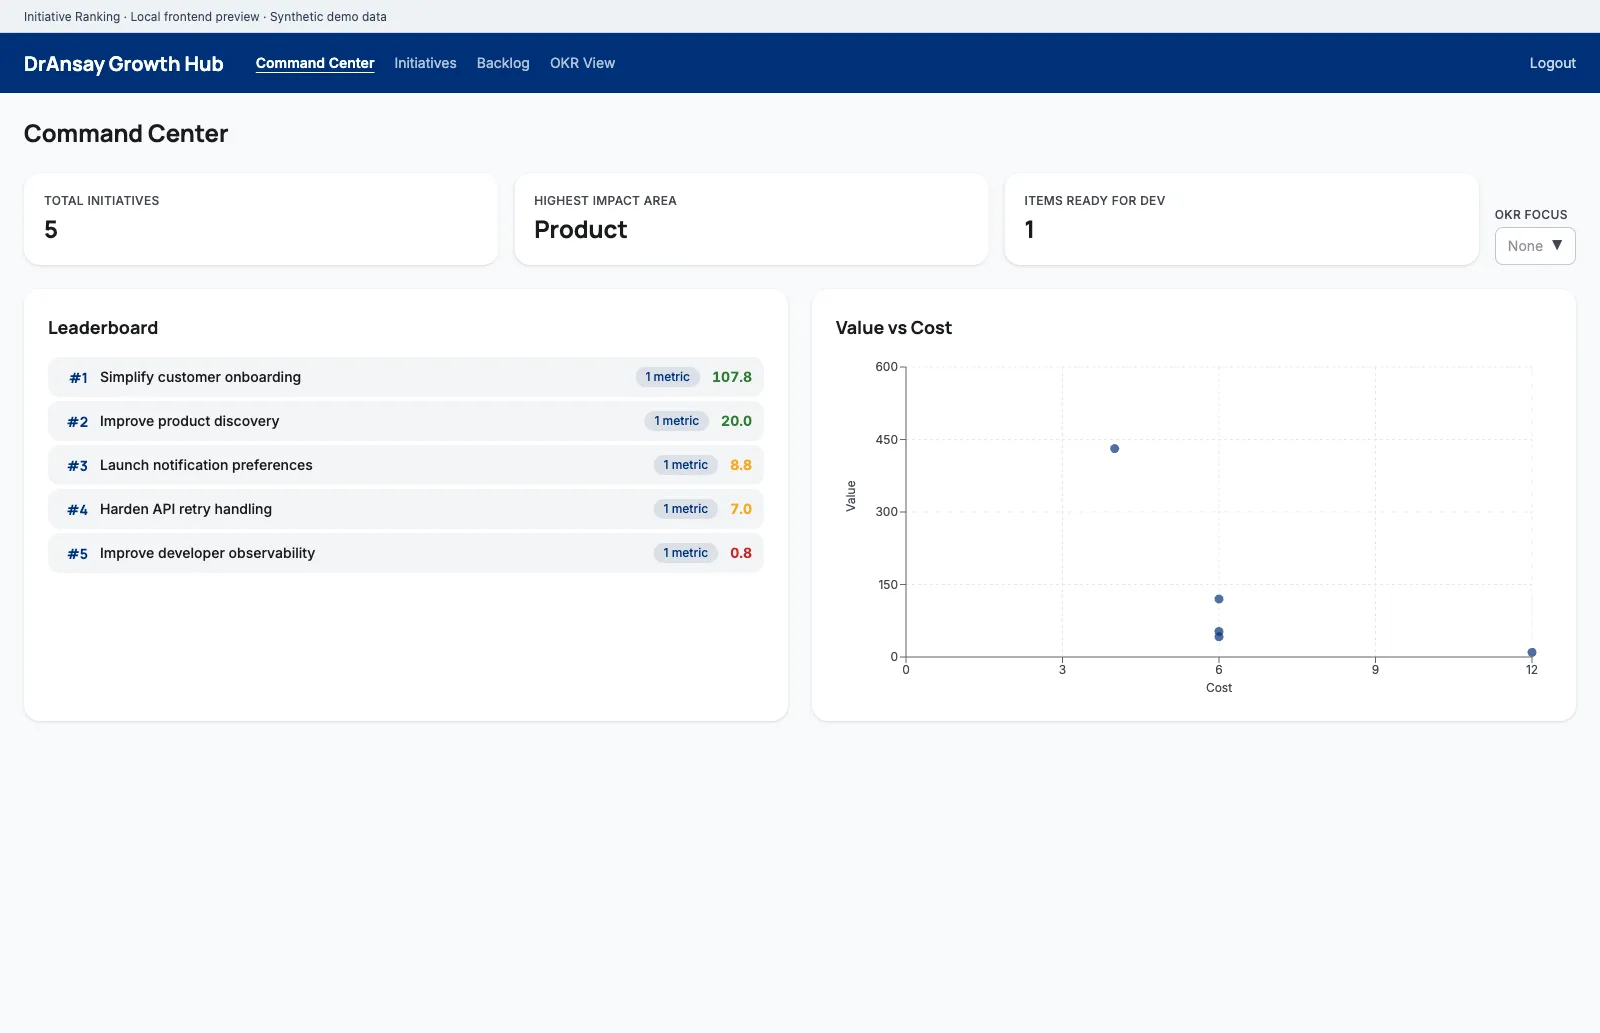
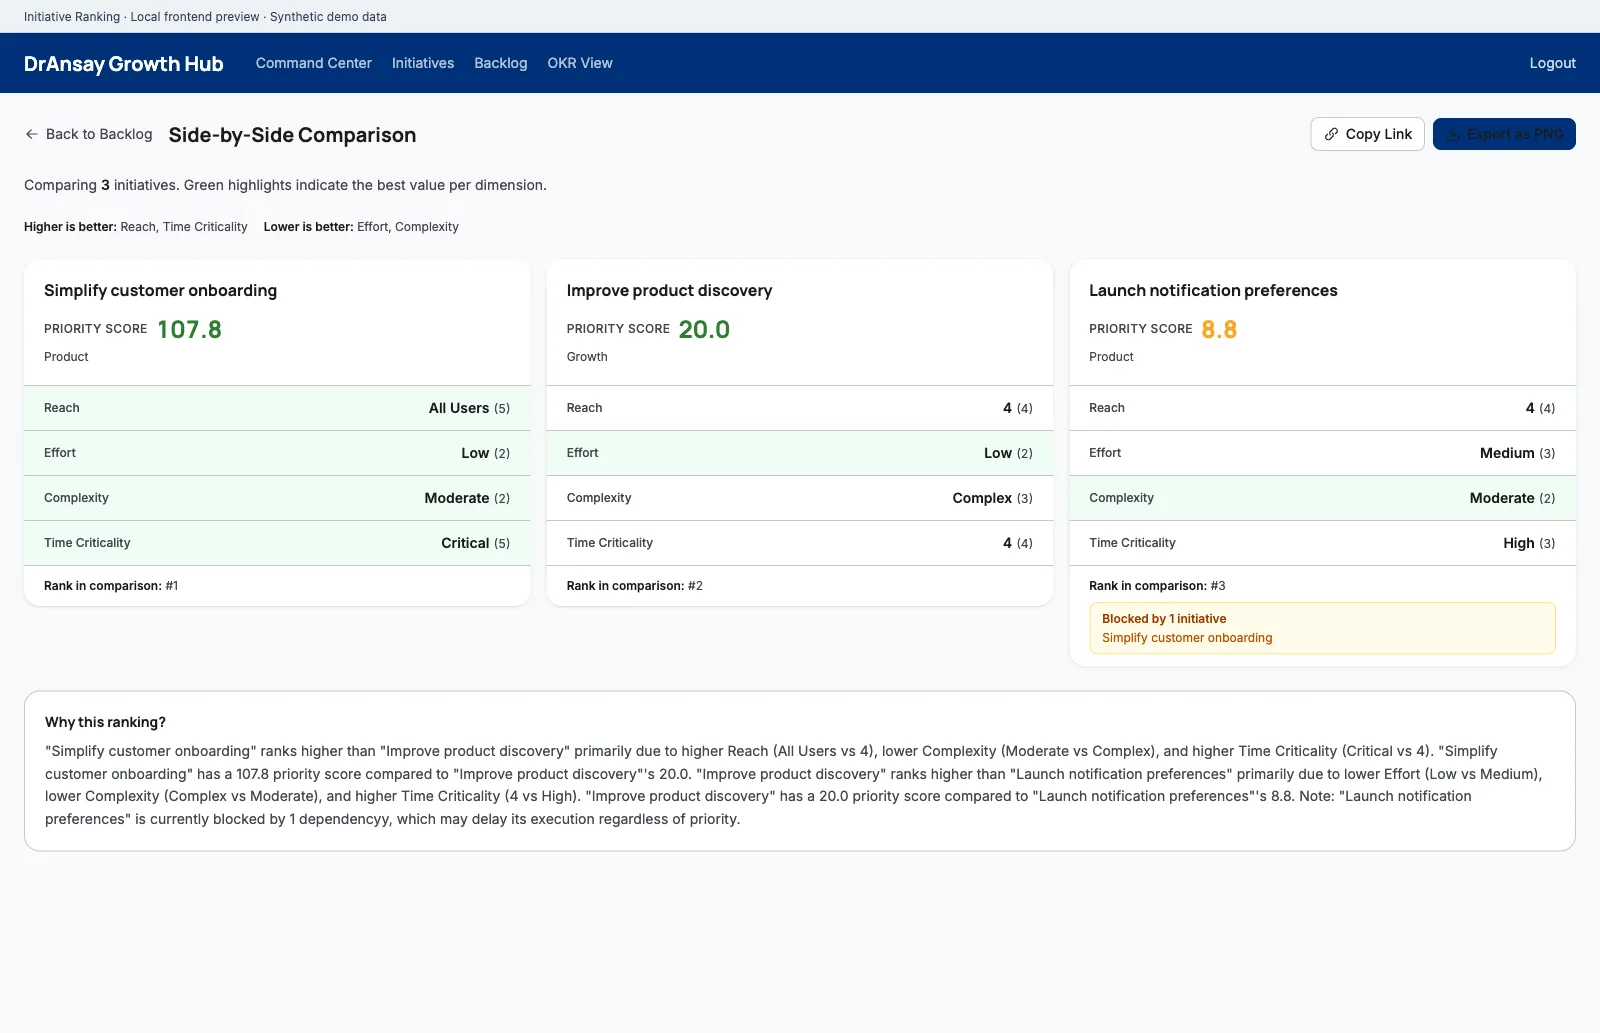
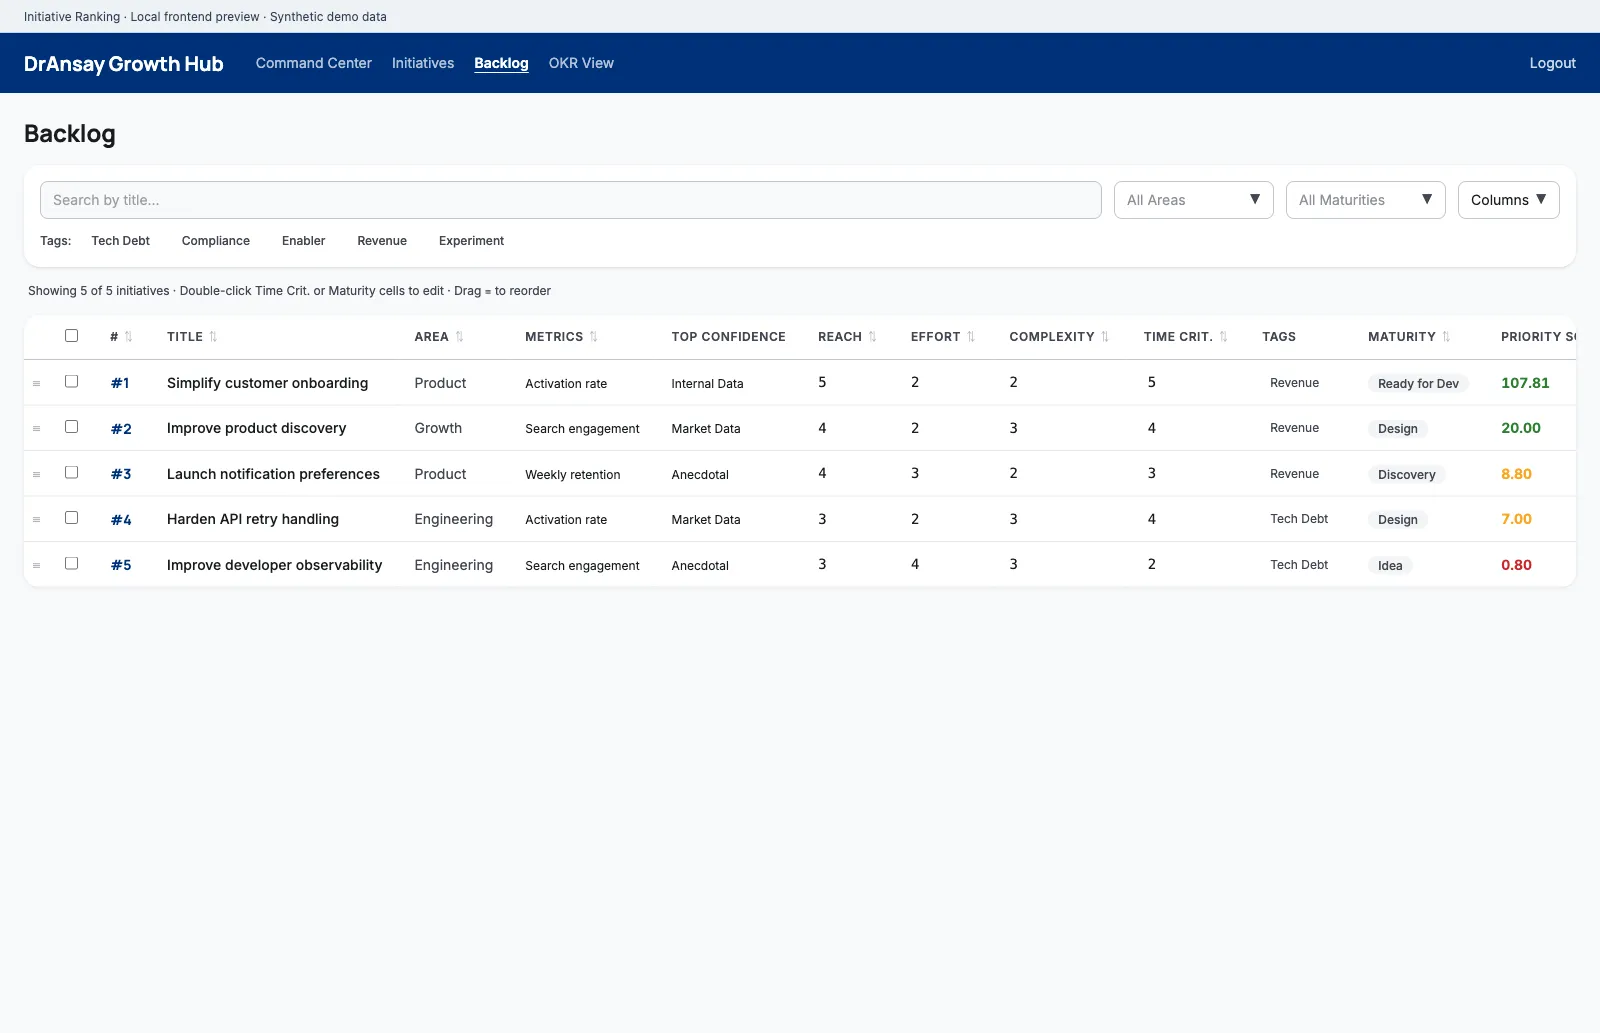
It produces a priority score and rank per initiative. The web app has a command center with a ranked list and a value-against-cost chart, a backlog table with search, filters and inline editing, a side-by-side comparison of up to three initiatives with a generated plain-language explanation of the ranking, an OKR view, and a detail page with the dependency chain. A manual reorder is recorded as an override, and the data model keeps score history. The editor also suggests scores for a new initiative. The suggestion is calculated from similar initiatives already scored, those in the same area or sharing tags, and it proposes a metric hypothesis when the same metric appears in at least two of them. It is a similarity calculation, not a language model.
The repository is a pnpm and Turborepo monorepo. The web app uses React, Vite, Tailwind, TanStack Query and Recharts. The API uses NestJS with Prisma on PostgreSQL, and the scoring and validation code is shared between them. It has no README; the root package.json provides dev, build, test and typecheck scripts, and a Docker Compose file starts PostgreSQL.
The images below are the real frontend running locally against synthetic demo data. Scores were computed by the real scoring engine on fictional initiatives.
Where it stands
It is early. We are still exploring the tool and working out what else it should do. The feedback so far has been good.
Evidence